Panopto Introduces New Video Analytics Suite
Reporting dashboard provides businesses and universities with insights into video viewing trends and engagement
SEATTLE, November 27, 2018 – Panopto today announced the latest update to its enterprise video platform. The release includes a new analytics suite built from the ground up to provide administrators, trainers, communication teams, and instructors with insights into their audience and video content.
In recent years, organizational use of video has skyrocketed. In the last 12 months alone, creation of new videos among Panopto customers has more than doubled, with the Panopto Cloud growing from 2 million to more than 5 million recordings. As businesses and universities continue to create more video, they increasingly need to understand viewing trends and audience behavior to better serve employees and students. In response to this market demand, Panopto is introducing a new video analytics suite. These analytics provide administrators and content producers with elegant visualizations that inform business decisions and improve audience engagement through the use of big data.

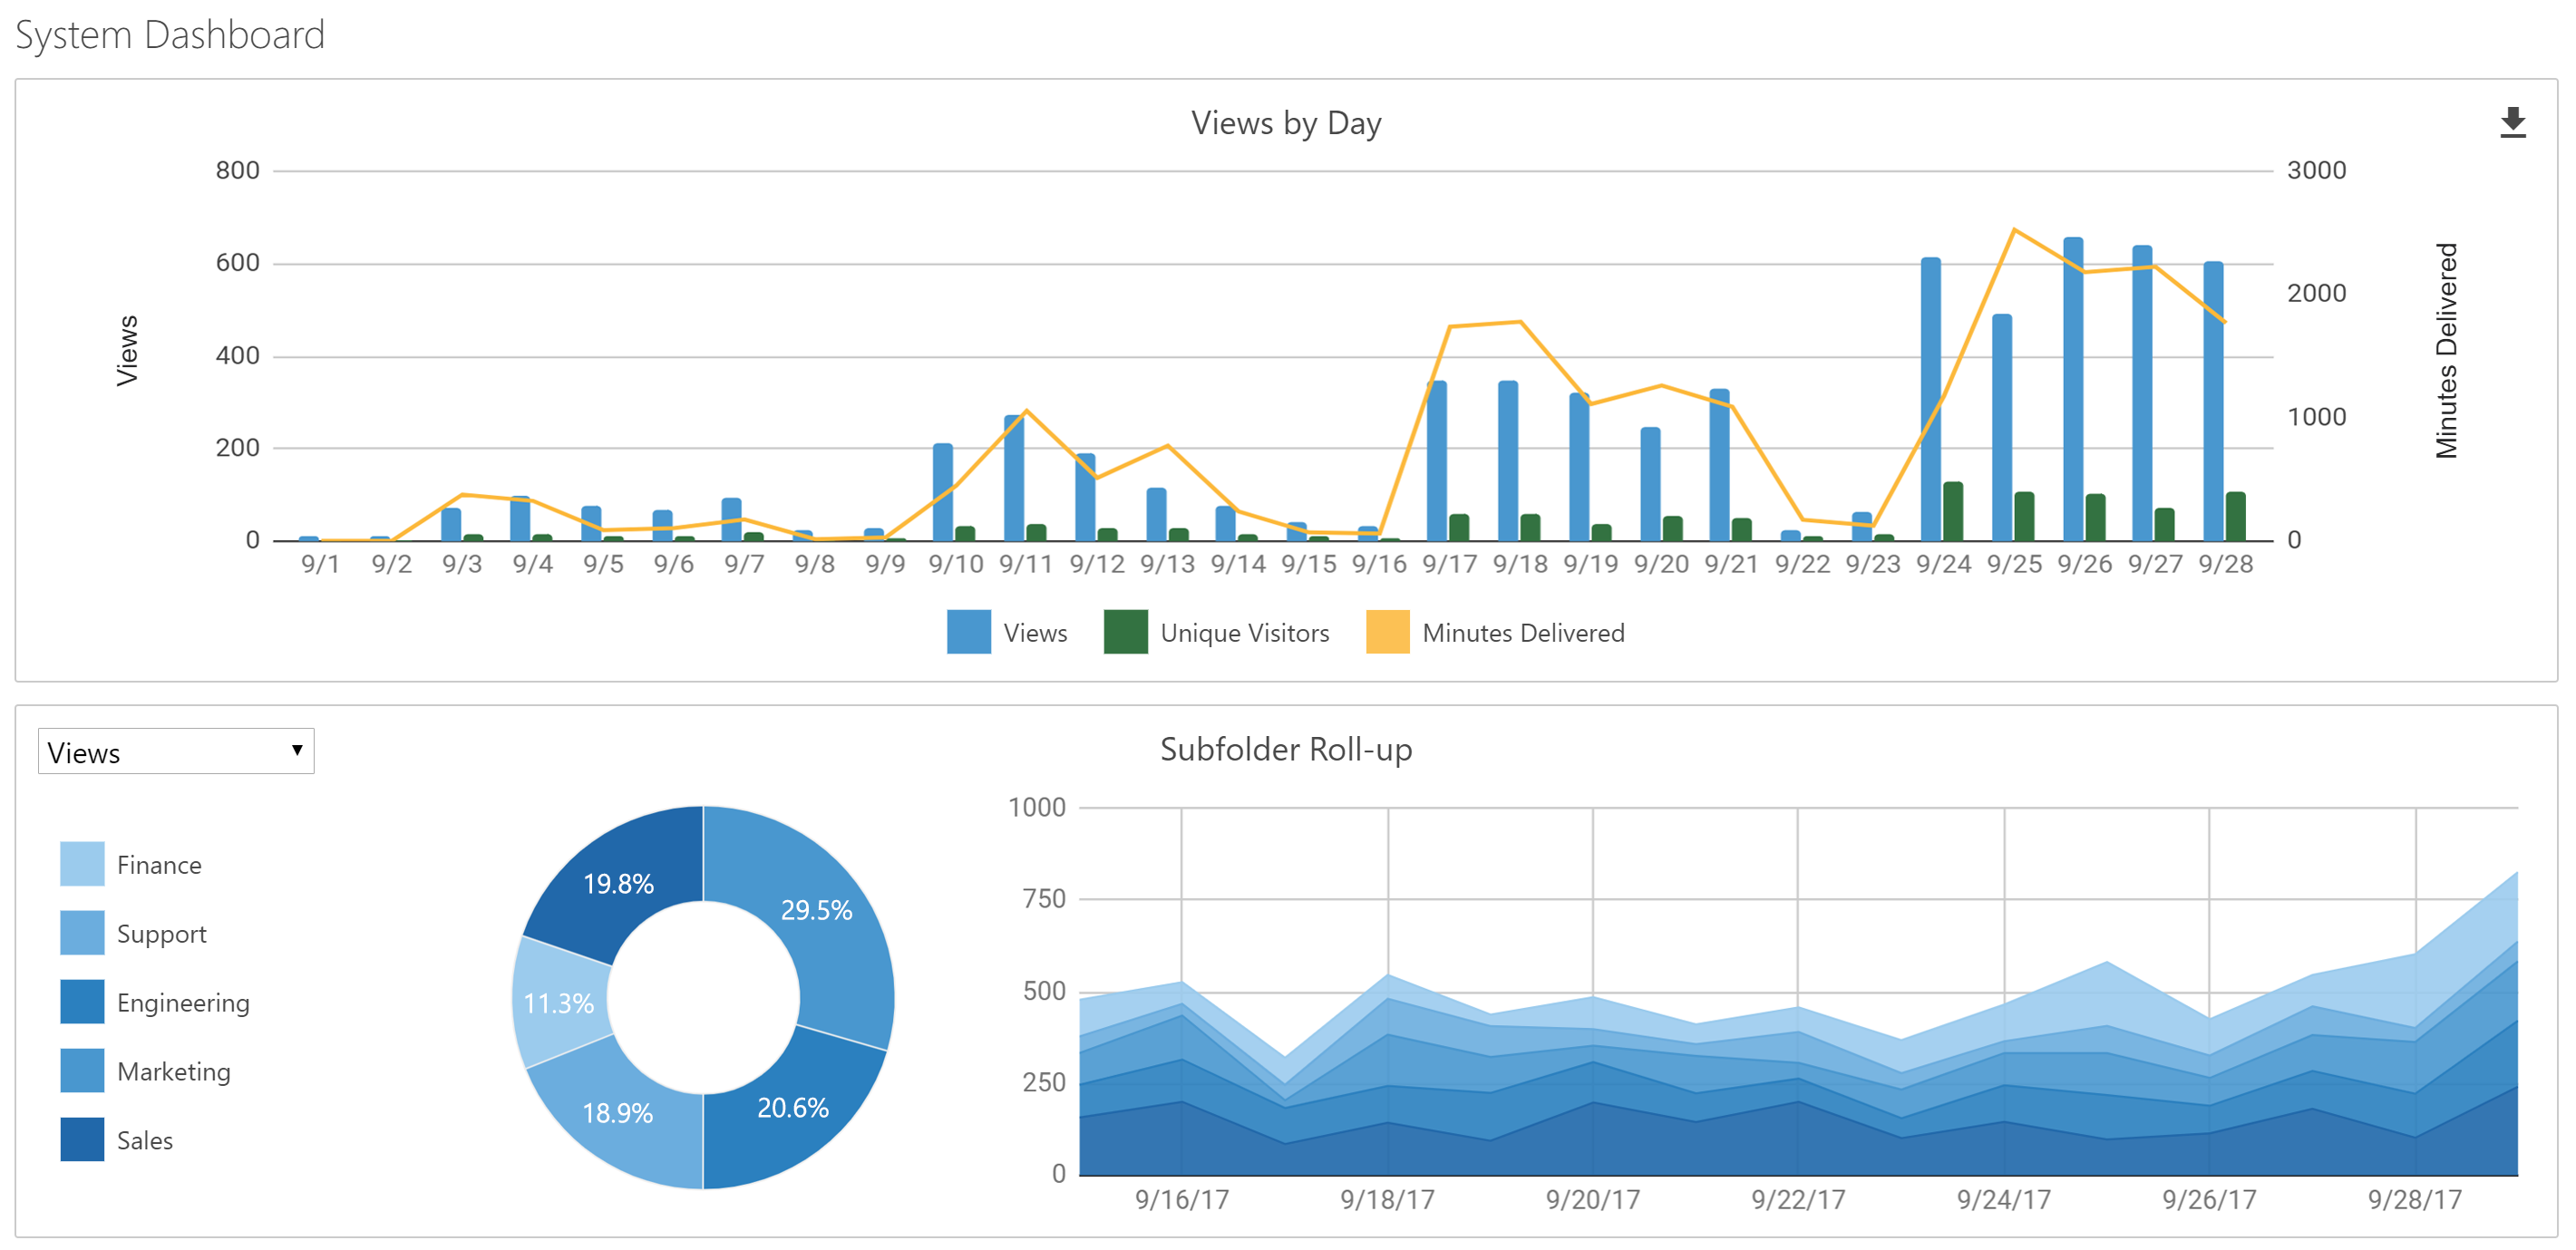
The Panopto analytics dashboard provides summary and detailed views of video content consumption and audience behavior.
For training teams, instructors, and faculty, Panopto analytics help identify the most engaged learners as well as those struggling with particular topics. New visualizations highlight topics of interest as measured by timestamped comments and personal notes.

In this sales training video, the spike in comments at 10 minutes indicates a topic of interest or confusion among the sales team. The spike in personal notes at 22 minutes suggests an important topic that viewers have bookmarked for future reference.
For corporate communications teams, the analytics provide insights into the most popular videos as well as those that generate the highest engagement and most discussion. This information can be used to identify the most compelling or confusing topics among employees. Corp comms teams can also identify trends in viewing behavior, including the reach and engagement of live events, as well as the degree of time-shifting among event views.
When combined with Panopto’s existing integrations with Google Analytics and Hive Insights, the new reporting dashboard provides businesses and universities with the most comprehensive set of insights into their audience and video content.
“Over the last decade, technologies like Panopto have driven large-scale video capture from a luxury to a commodity,” said Eric Burns, co-founder and CEO of Panopto. “The most pressing challenge today is managing the massive libraries of video that result from a successful capture strategy and then generating business insights about the content and audience. Today’s release of Panopto is a big step toward pervasive use of analytics and viewing patterns to help video producers improve their content and audience engagement.”
Starting today, Panopto customers will have access to the new video analytics dashboard at no additional cost.
About Panopto
Panopto helps businesses and universities create searchable video libraries of their institutional knowledge. Since 2007, the company has been a pioneer in video capture software, video content management systems, and inside-video search technology. Today, Panopto’s video platform is the largest repository of expert learning videos in the world. Headquartered in Seattle, with offices in Pittsburgh, London, Hong Kong, and Sydney, Panopto has received industry recognition for its innovation, rapid growth, and company culture. For more information, visit www.panopto.com.


